Visualizing Effective Lineups with Timelines

Do you have the best tools to make informed lineup decisions? Picking optimal lineups is critical to winning games, and being able to see how each lineup performed at different parts of the game can help you make the best possible substitution decisions.
The Lineup Timelines in Hoopsalytics’ Game Summaries let you visualize shooting, turnovers, plus/minus and more for each stint a player or lineup appeared in a game. The screen shot above shows how part of a lineup timeline appears for a St. John’s college game.
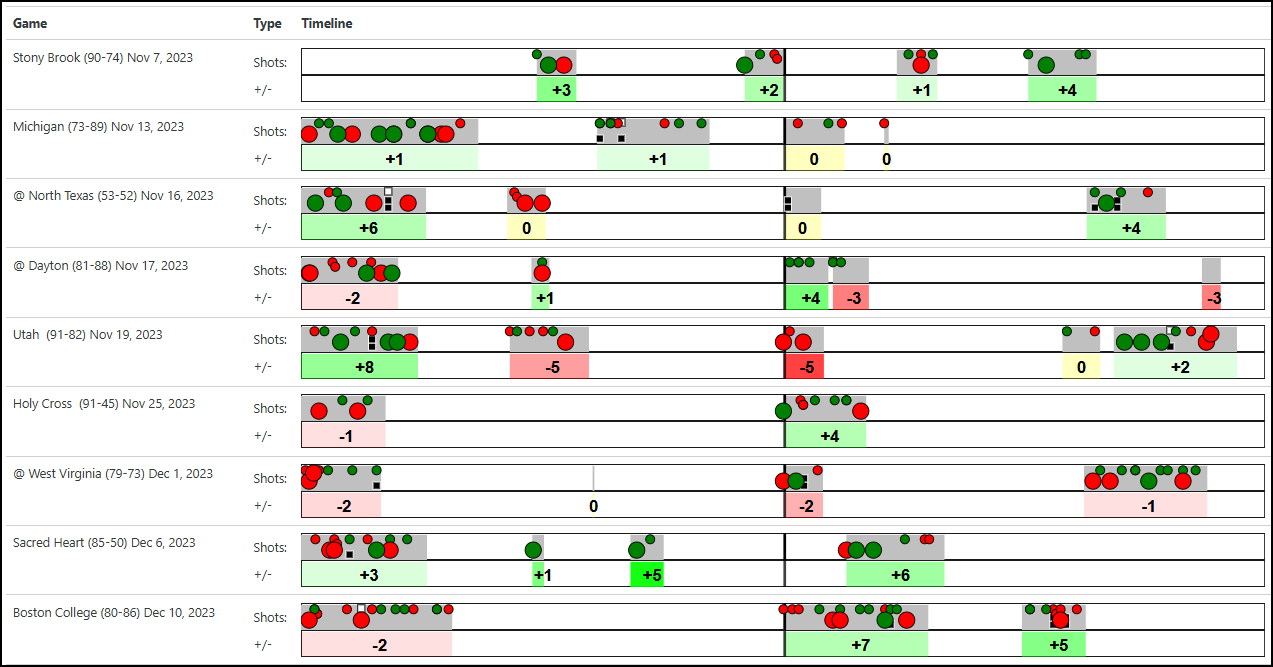
You can also see game-by-game lineup stats and timelines. Here’s how one of St. John’s lineups performed in several games:
Comprehensive lineup stats and visualizations are one of the ways you can use Hoopsalytics to win more games. This feature is available for all teams using the Hoopsalytics system, and you won’t find this in any other stats platform.