Measuring Defensive Efficiency with Blocks/Fouls and Steals/Fouls Stats

Defense wins championships, and being better able to measure how effective each of your players are can help you reach that next level.
Unlike other systems, Hoopsalytics differentiates between shooting fouls and non-shooting fouls, which allows us to create more advanced analytics. So with this capability, you can use two metrics that will give you a really good idea of who your cleanest defenders are: Blocks vs Shooting Fouls and Steals vs Non-Shooting Fouls.
Blocks / Shooting Fouls
This ratio represents how often the player executes a clean block versus fouling a shooter. On some of my teams, the ratio varies wildly. We teach our players to wall up whenever possible, but our less disciplined players clearly commit more shooting fouls.
For this team, both Ben and Charlie were two of our tallest players. But Charlie had way more blocks versus shooting fouls, and Ben committed way more shooting fouls than blocks, as you can see here:

Steals / Non-Shooting Fouls
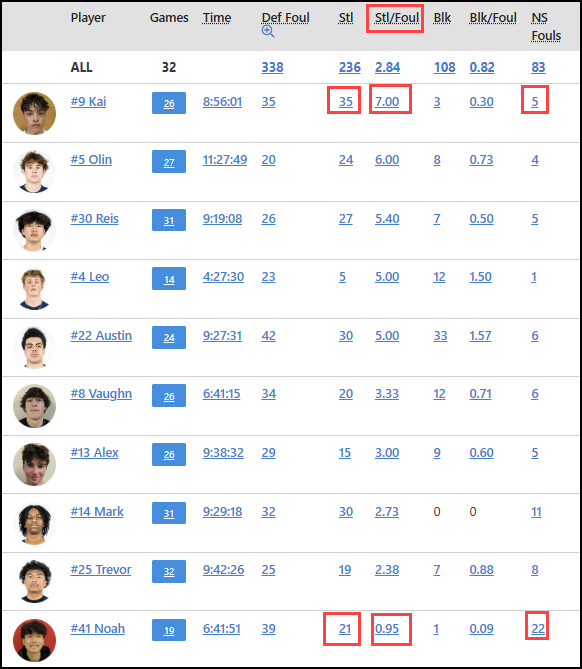
For your guards and perimeter perimeter players, you can use the same type of analysis on steals versus non-shooting fouls. In the example below, you can see two very different profiles for Kai and Noah. Kai was an excellent defensive player, and really clean. His ratio was an amazing 7:1. Noah was also a strong defender, but fouled a lot more often.
How to Customize Defensive Box Scores
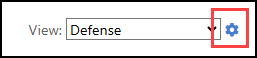
With Hoopsalytics, you can customize any box score or create your own view. To add these two stats to your defensive box score, start by clicking the customize button next to the Defensive view.
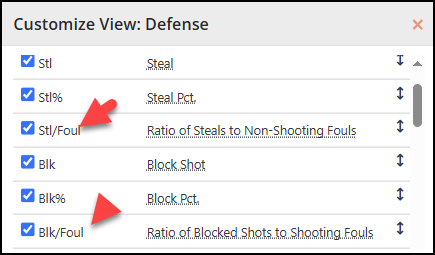
From there, tick the the Blk/Foul and Stl/Foul stats to add them to your defensive box score.
Summary
No other stats program has this level of analytics. If you’re serious about creating a championship team, especially with better defensive insights, you will want to add Hoopsalytics to your coaching toolkit.